
Do Think Twice, It's Alright
In our last post we described why critical thinking is a necessary and valuable skill that can help to improve decision making and unlock bigger topline growth opportunities. In this post we turn theory into practice.
This is the scene.
It’s the summer of 2017. We are a fly-on-the-wall in the office of an Automotive executive. He is trying to establish his brand in a fast-growing Mobility as a Service (MaaS) ecosystem, and particularly within urban mobility.
He is open to doing this via acquisition or by building it in-house, and has begun to evaluate a few of the emerging solutions and business models in the market; we are able to spot a coffee stained business model canvas, saddled between an Islay Single Malt and Elon Musk’s biography on a side table in the corner of the office.
But he has a nagging feeling that he hasn’t actively, persistently or carefully considered the data he has gathered, the hypotheses he has formed or the assumptions he has made. Becoming aware of this he reaches for a checklist he spotted on LinkedIn a few weeks ago, and proceeds to look through the questions.

What insights have we generated to suggest there is a pain point and problem to solve?
He takes out his Mont Blanc and begins to scribble with a rare level of lucidity…
Urban areas are choking with congestion: road and public rail networks are nearing capacity, the average cost per mile of travel is rising and particulate air pollution is posing a public health risk. The status quo is economically, socially and environmentally unsustainable – and this situation will only be compounded as the percentage of people living in urban areas increases from 55% today to a forecast of 68% by 2050. This means we need to better utilise the increasingly constrained physical space in cities for the purposes of travel, whilst controlling the cost per mile of mobility and finding cleaner alternatives.

An analysis of passenger journey’s across a representative sample of users – from the commuter travelling to work from the suburbs to the retiree reliant on public transport networks – indicate that we are most underserved during their first and last mile of travel. These are the journey’s we make from our front door to a transport hub that connects us to the next part of our journey. These journeys are often done on foot (which is slow), by bus (which is faster, but not the most direct way of getting from A to B) or on a personally owned push bike (which requires us to lock it up and return to it at the end of the day, plus an initial investment cost). Although these journeys comprise short physical distances, they still represent a significant amount of total travel time (up to 50% of an end to end journey), especially in areas underserved by public transport networks.
The world is speeding up, but we are slowing down
Making these journeys using existing modes of road transport personal vehicles, taxis and buses are taking longer and longer as vehicle traffic speeds in many of those city centers are now averaging as little as 15 kilometers an hour (9 miles per hour).2 A fascinating big data analysis conducted by Strava, a platform that allows athletes to track their sports activities and connect with other athletes, calculated that running to work in London is now faster than travelling by road.3
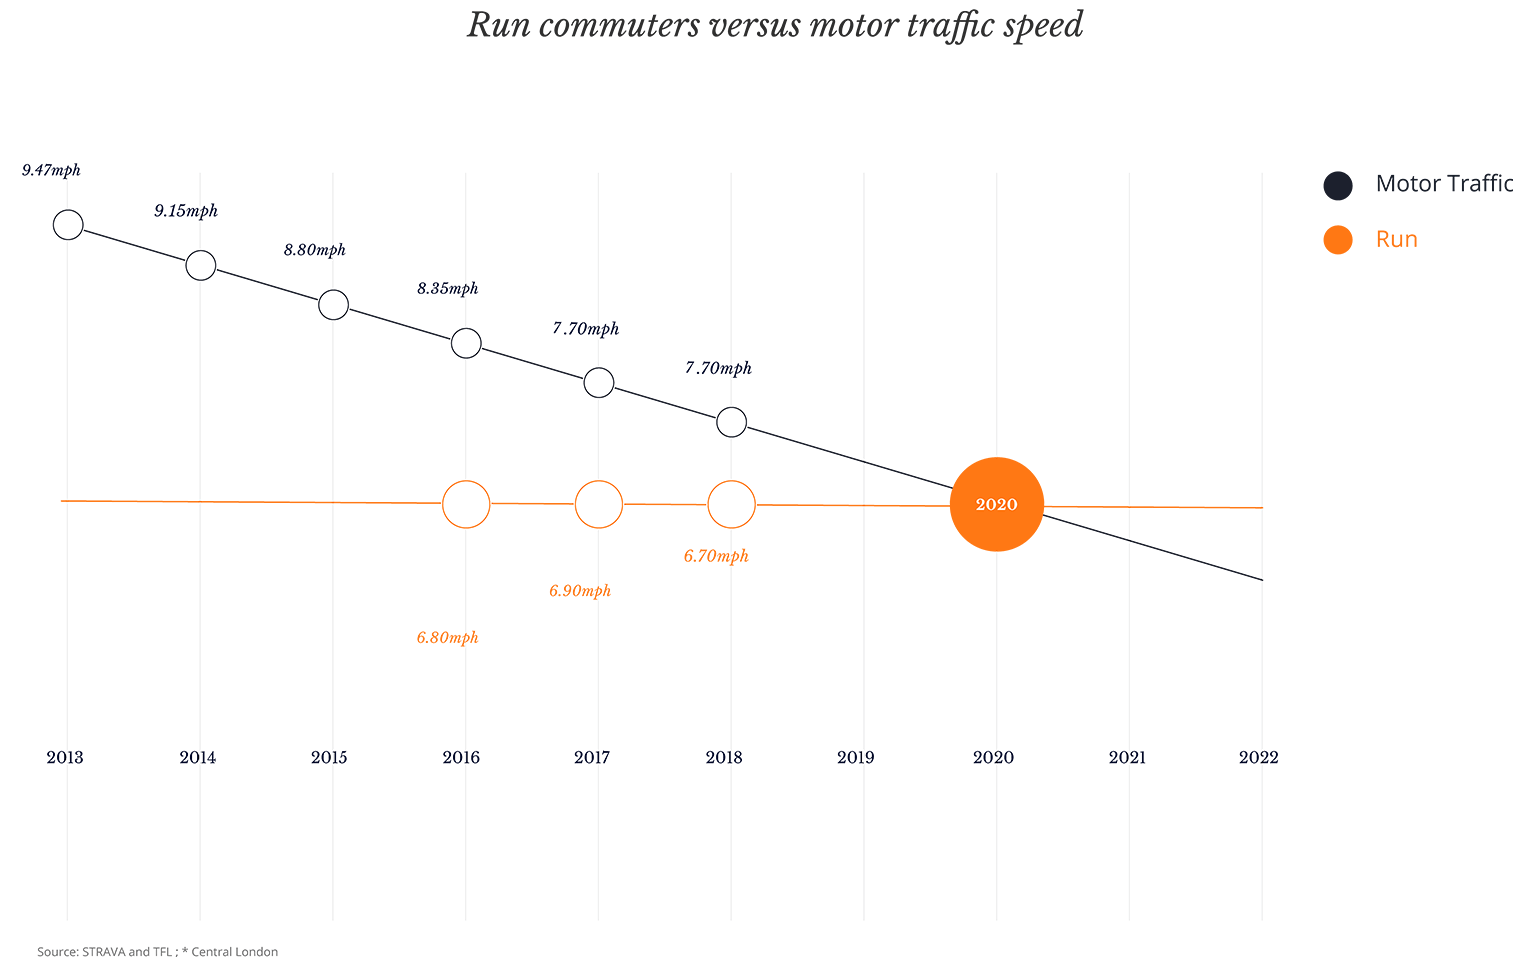
Source: STRAVA and TFL ; * Central London
This becomes even more interesting when we overlay data that shows the average distance people are travelling is skewing towards short distances — below 15 miles (24km), most probably due to increasing urbanisation. This analysis of US car journeys estimates the volume of journeys and spotlights the potential value pool:
- 425 billion passenger miles per annum between 0-6 miles (0-9.5km)
- 612 billion passenger miles per annum between 7-15 miles (11-24km) and;
- 1.06 trillion passenger miles per annum above 15 miles (24km +)
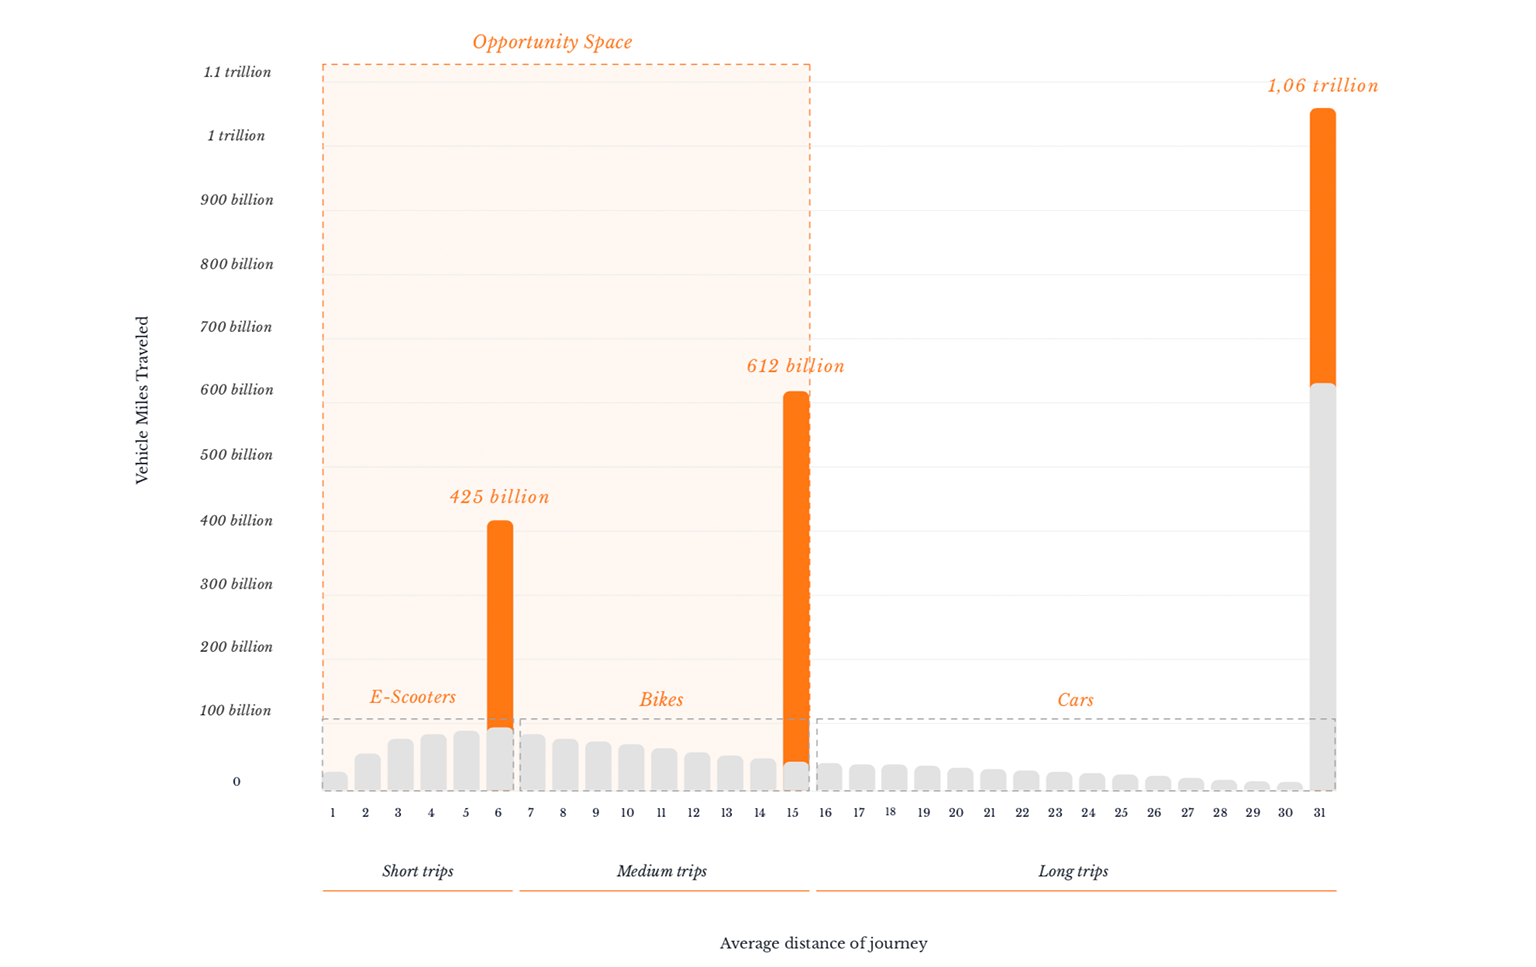
Source: Medium, Oliver Bruce
These datasets have helped the exec establish that micro-mobility (the industry term for short distance transport) could serve an unmet consumer need in a very big market ( journeys under 9.5 km). This has helped him to narrow his focus, but he is aware that he is still missing fresh insights and a strong point of view.
- How do passengers decide between different transport options?
- What could these options be?
- Where should my organisation play in an evolving mobility value chain?

How passengers choose between competing options
A large number of urban passengers now use some form of journey planning or mobility aggregator like Google Maps, CityMapper, Moovit to get from A to B. These services provide the passenger with a shortlist of options mixing transport modes and travel distances. The majority of passengers decide which one to take based on travel time, cost, accessibility and weather. The solution our exec invests in needs to win based on these decision-making parameters and hierarchy of needs.
But it also needs to seamlessly fit into a multi-modal world. Every signal in the market – from Uber’s Google maps integration to Daimlers move into building an urban mobility operating system – suggest accessibility and integration is no longer a differentiator, but a hygiene factor. This allows him to establish the following design principles:
- Easy integration with other modes of transport to enable multi- modal end to end trip planning, including payment;
- Affordable, or at least price competitive compared to substitute products and;
- Regulatory acceptance from cities and countries where this solution could be launched (he is predicting that there will be a backlash from authorities against companies who land and expand in major cities before gaining approval).
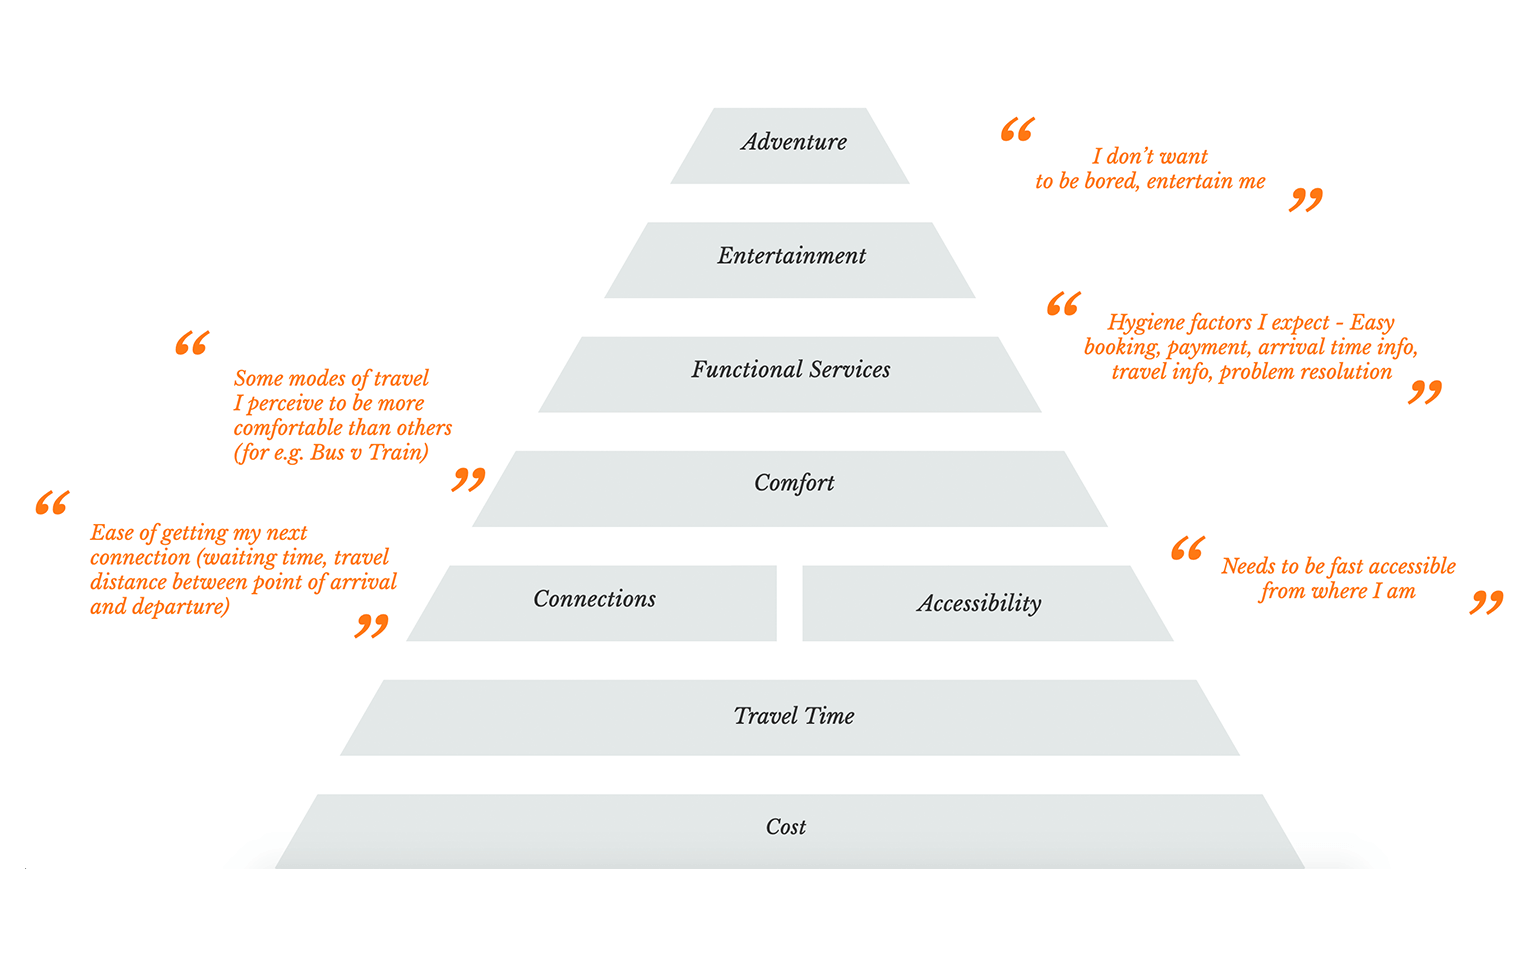
At this point it could be tempting to start generating ideas, but we know we are still short of a fresh consumer insight. The decision-making pyramid helps us to understand how passengers decide between options, but we still don’t have a read on their intrinsic motivation.
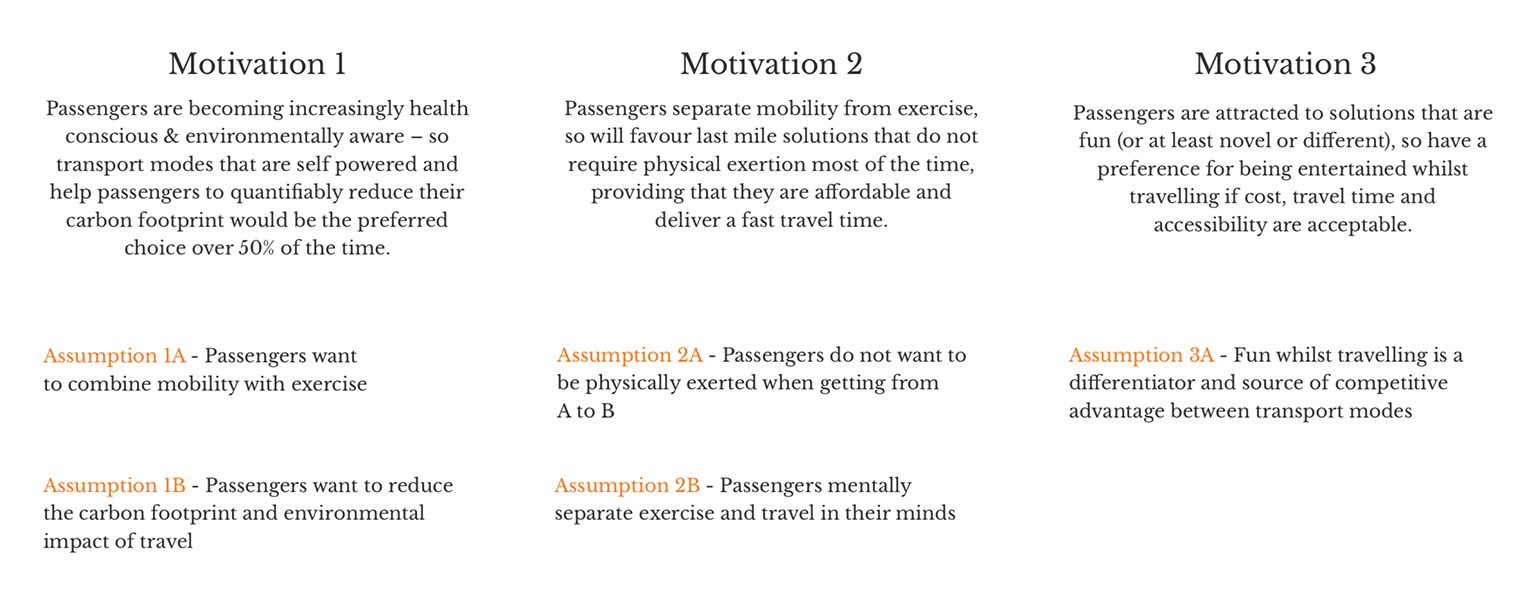
We therefore need to develop a set of hypotheses that we can test to establish which motivation is most common, most of the time. This will help us to develop a first mile / last mile proposition that captures the greatest possible share of passenger journeys.
Establishing where we should play and how to win
As well as knowing what motivates consumers, we need to understand how our organisation fits into a fast-evolving mobility value chain. Why? Because this allows us to evaluate where new value is being created, and figure out where and how we could win.
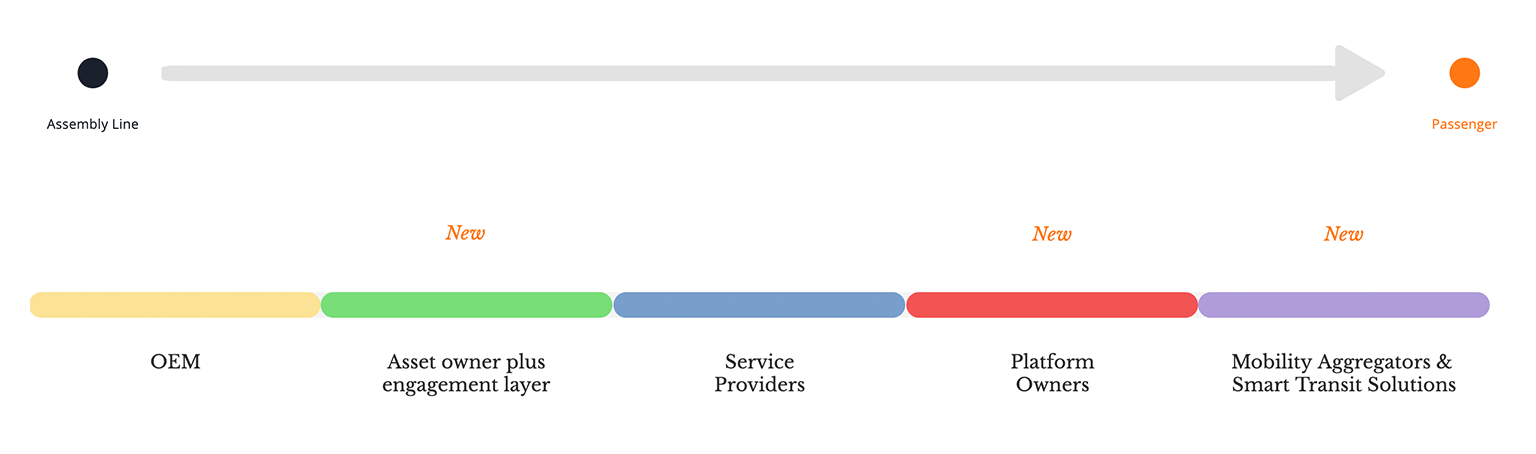
- The yellow layer is the OEM execs core business – the manufacture, sale and leasing of vehicles (cars, buses, trucks). This also includes the sale of additional ‘on top’ services like maintenance and fleet management. The main KPI that drives this business are units sold per financial year, and increasingly service revenue as a percentage of asset sales.
- The green layer denotes companies who use their own assets to operate a service. Good examples would be MyTaxi, MoveNow, Ofo, MoBike and e-scooter startups like Lime, Bird, Circ and Tier. These are good analogs for what the automotive exec could do. He knows his organisation has already missed the bus when it comes to use cases like urban car sharing. The KPIs that drive this business are Monthly Active Users (MAUs), Average Ride Length and Usable Life per Asset.
- The blue layer are service providers (like bus operators) who buy or lease the assets an OEM manufactures. These are the OEM execs current customers, but they too want to move upstream. Flixbus is a good example of a new service model that is disrupting this space and moving service providers in the direction of platform owners.
- Then comes the red layer of platform owners, like Uber and Ly, who don’t own assets but have scaled enormous platforms that connect drivers with passengers. ‘Owning the platform’ has become a new kind of holy grail because Amazon, Spotify, Netflix, Alibaba, The Honest Company and many besides have rapidly become highly valuable platform businesses. But the OEM exec knows this is a very hard place to win as it relies first mover advantage and reaching a critical mass of users for there to be any chance of becoming profitable.
- The purple layer are Mobility Aggregators and Smart Transit solutions that help passengers plan a route from A to B – they include Google Maps, Citymapper, Moovit and city branded mobility apps. The OEM finds this layer of the value chain particularly interesting, because he has existing partnerships with transport authorities in a number of major global cities. This is an unfair advantage he has over external disruptors and one he can leverage to position his organisation to play an active role in supporting cities and regions to solve their transport and public health challenges.

What makes or breaks the business model?
The exec calls in a gifted young analyst and asks them to build a few schematic Excel models…
After being talked through these excel models the OEM exec establishes that the last mile business model and unit economics are significantly different from manufacturing cars or even leasing them. He establishes that in the last mile world four levers make or break the viability of a business:
- Customer Acquisition Cost (CAC) – getting passengers to try your service costs money, and lots of it. Marketing, promotions, bonuses for referring a friend add up to a high CAC. Therefore a positive K-factor (virality) is required to affordably increase customer acquisition. This is an important element to quantify, because corporate venturing has little appetite for high CAC costs (and burning dollars to build a user base).
- Monthly Active Users or Total Monthly Journeys – this is the volume driver in the business model. Passengers need to be using your service for you to recoup the purchase / manufacture cost of the asset, service build costs and ongoing operational costs. In order to be profitable, the provider needs to achieve a certain number ‘rides per day’ per asset.
- Average ride length –revenue per asset is calculated by multiplying the total number of journeys made by the average length of each journey. One element of revenue is fixed (the price unlock and hire the asset i.e. $1), the other is variable (the cost per minute of using the asset). Estimating the variable component is vital for the OEM exec to understand what average ride length the service would need to reach for it to be profitable. He can sense check this based on the data he has already gathered. The average speed of bike travel is roughly 20 kph and the average travel distance for micro mobility is around 5 km (too long to walk, too short to warrant driving or getting the train), which means average ride length would be around 15 minutes. This figure seems plausible. He uses this as a baseline, and does a sensitivity analysis in 1 minute increments below and above this figure to look at the impact on estimated profitability.
- Usable life per asset – stuff breaks. The OEM needs to estimate how many rides he is going to get out of an average asset before it is written off (either due to wear and tear, or because it gets dumped in a canal). Asset durability and build quality is therefore important. A cheaper purchase price might be a false economy if the asset delivers significantly fewer rides over its life compared to a more expensive, but better constructed asset.
This exercise has helped him to understand: how much he can afford to spend on acquiring a customer, how often he needs them to use his service, for how long, and how many times an asset needs to serve them. An example of what a good output looks like is here.

Have we identified the big and important assumptions?
The exec picks up the phone to his head of logistics, who assumes nothing and plans for every eventuality…
When it comes to building a new service there are many things we wish to be true. The nature of innovation means we need to make assumptions about the future to break new ground. However we need to go in with our eyes open – a failure to identify these assumptions at the start of the process could trip us up down the line.
Here are a few relevant examples that real businesses have failed to flag:
- We can build this new solution or deliver it through a partner before our competitors i.e. before we lose first mover advantage. Many large organisatons struggle with agility in their governance and decision-making processes. Their scale and complexity means the statement above is subject to multiple further assumptions: we can get buy in from leadership and move to solution development within months, not years; our organisation has the risk appetite to invest in a solution that is outside of our core business, and so on.
- Regulators (cities, regions, national governments) will permit our service. This is a critical assumption we cannot directly control, but that we can influence. It’s vital to flag this one early as it impacts our ability to scale our solution if certain regions or countries pass legislation to limit our service or prevent us from operating.
- We will not bear the cost of fines incurred by users of our service. Some regulators are forcing service operators to shoulder the cost of assets le on pavements, this could be an unwelcome surprise on our balance sheet if you haven’t factored it in. This is a more detail orientated assumption, but the devil is oen in the detail.
Hint: tree diagrams are a great way of capturing and linking a growing list of assumptions. These can help to priortise the ‘big and important’ assumptions and build further supporting assumptions around a core thing we ‘need to be true’ for our business to fly.
Have we critically evaluated the different options available to us?After all this thinking, doing nothing is still an option. If we believe that we have gathered enough insight and data to begin developing a new solution (i.e. we have met Jeff Bezos’ 70% rule), then a new set of options and decisions await us:
- Will we build the solution ourselves (make it), buy it from someone else or partner to deliver it?
- Where will I position myself in the value chain? Will I own the asset and develop the customer engagement layer, or will I try to become the platform provider and avoid owning any assets?
- Is this new solution expected to be self sustaining, profit making or a tactic for driving growth elsewhere in my business?

At this stage in the critical thinking process it is worth pausing to consider a wider spectrum of options and evaluating which ones best suit our strategic goal. To support this endeavor the OEM exec reaches for that Single Malt you might have spotted earlier. The question that now arises, is which cigar to pair it with?
SOURCES
1. UN data hub – [accessed July 2019] – https://www.un.org/development/desa/en/news/ population/2018-revision-of-world-urbanization-prospects.html
2. McKinsey, Micromobiity’s 15,000-mile checkup, 2019
3. Forbes, [accessed July 2019] – https://www.forbes.com/sites/carltonreid/2018/12/08/ running-to-work-quicker-than-driving-shows-strava-data-from-british-cities/#65514dbdbe01

Max is an Engagement Manager in the Central Europe Commercial Strategy team, based in Munich. He thrives when helping his clients exploit their strengths to realize new growth opportunities and win in competitive markets.
We respect your privacy
We use Cookies to improve your experience on our website. They help us to improve site performance, present you relevant advertising and enable you to share content in social media. You may accept all Cookies, or choose to manage them individually. You can change your settings at any time by clicking Cookie Settings available in the footer of every page. For more information related to the Cookies, please visit our Cookie Policy.